Plot the double kinship matrix
Usage
plotKinship2(x, y = c("image", "hist"))imageKinship2(x)histKinship2(x)
Arguments
- x
- A square matrix of double kinship coefficients.
- y
- A character, the type of the plot.
Possible values are
"image"and"hist". The default value is"image".
Description
The main function that calls imageKinship2 or histKinship2
depending on value of y argument.
Details
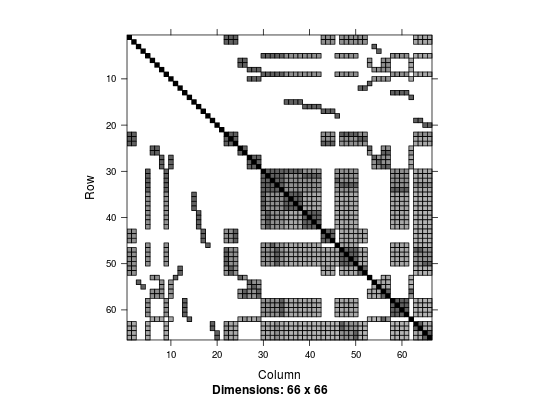
imageKinship2 function calls image function from Matrix package.
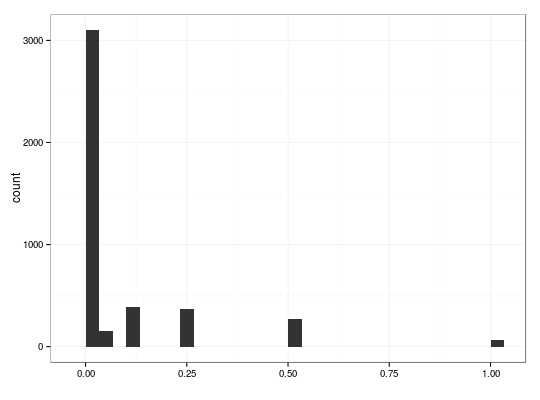
histKinship2 function plots a histogram based on ggplot2 package.
Examples
# load `kin` kinship matrix from `dat50` data set data(dat50) kin2 <- 2* kin # double kinship matrix plotKinship2(kin2) # equivalent to `imageKinship2(kin2)`
plotKinship2(kin2, "hist") # equivalent to `histKinship2(kin2)`stat_bin: binwidth defaulted to range/30. Use 'binwidth = x' to adjust this.